
Power BI vs Excel vs Tableau: Which Data Analytics Tool Should You Learn First in 2027?
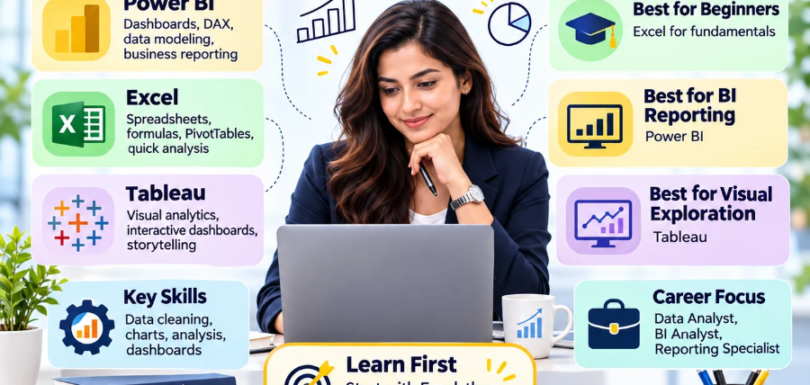
Data Analytics and Business Intelligence are transforming how organizations analyze information, measure performance and make business decisions. Three widely used tools in this field are Microsoft Excel, Microsoft Power BI and Tableau. But which one should beginners learn first? And which tool is better for building a career in Data Analytics or Business Intelligence? This guide compares Power BI vs Excel vs Tableau to help you choose the right learning path in 2027. What Is Microsoft Excel? Microsoft Excel is a spreadsheet application used for organizing, analyzing and presenting data. It is widely used in business operations, finance, reporting and everyday data analysis. Key Excel skills include: Best for: Beginners, business professionals, financial analysts and operational reporting. What Is Microsoft Power BI? Microsoft Power BI is a Business Intelligence platform that helps organizations connect, transform, model and visualize business data. It supports interactive reports, dashboards and collaborative analytics. Key Power BI skills include: Best for: Data Analysts, BI Developers, reporting professionals and business intelligence teams. What Is Tableau? Tableau is a visual analytics platform that helps users explore data, build interactive visualizations and communicate insights. It supports data exploration, analytical dashboards and business reporting. Key Tableau skills include: Best for: Data visualization specialists, BI Analysts and professionals focused on visual analytics. Power BI vs Excel vs Tableau: Key Differences Feature Excel Power BI Tableau Primary purpose Spreadsheet analysis Business Intelligence Visual analytics Beginner learning Generally easiest Moderate Moderate Data cleaning Power Query Power Query Tableau Prep Visualization Charts and PivotCharts Interactive reports Advanced visual exploration Data modeling Power Pivot Semantic models and DAX Relationships and calculations Collaboration Microsoft 365 Power BI Service Tableau Cloud/Server Suitable careers Reporting, finance, analytics Data Analyst, BI Developer BI Analyst, visualization specialist All three tools can analyze and visualize business information. Their strengths differ depending on the reporting environment and business requirements. Which Tool Should Beginners Learn First? Step 1: Start with Microsoft Excel Excel helps beginners understand data organization, formulas, calculations and reporting. Learn PivotTables, charts and Power Query before progressing to advanced visualization tools. Step 2: Learn SQL Fundamentals SQL enables analysts to retrieve and manipulate information stored in relational databases. Understanding joins, filters and aggregations makes working with business datasets easier. Step 3: Learn Microsoft Power BI Power BI is a practical next step for learners familiar with Excel and SQL. Focus on Power Query, data modeling, DAX and interactive dashboard development. Step 4: Explore Tableau Based on Career Goals Tableau can expand your visualization capabilities, particularly when employers or projects use its analytics ecosystem. You do not need to master all three tools before applying for entry-level analytics positions. Power BI vs Tableau: Which Is Better for Your Career? Neither tool is universally better. Choose Power BI if you want to: Choose Tableau if you want to: Research local job descriptions before choosing a specialization. Real-World Projects to Build Your Portfolio Practical projects help demonstrate your analytical abilities. Include project objectives, data-cleaning steps, visualizations and business recommendations. Is Power BI Difficult to Learn Without Programming? No programming experience is required to begin learning Power BI. Beginners can start with importing data, creating charts and building basic reports. Advanced skills, including DAX, data modeling and performance optimization, require additional practice. Learn Microsoft Power BI with Tech Learniversity Tech Learniversity offers the Microsoft Power BI Professional Certification Course, designed to help learners build practical Business Intelligence and dashboard development skills. Program highlights: Eligible learners receive a Tech Learniversity course completion certificate according to program requirements. Microsoft’s PL-300 certification requires a separate examination. Build practical Data Analytics skills and take your next step toward a Business Intelligence career. Explore Our Microsoft Power BI Professional Certification Course