
Business Intelligence

Power BI Free vs Pro vs Premium: Which One Should You Choose?

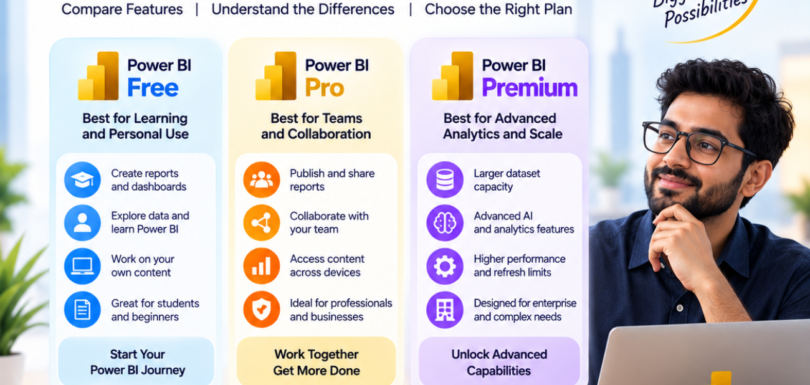
Power BI Free vs Pro vs Premium: Which One Should You Choose? Microsoft Power BI is one of the most popular business intelligence and data visualisation platforms available today. However, choosing the right Power BI license can be confusing because Microsoft offers multiple options, including Power BI Free, Power BI Pro and Power BI Premium Per User (PPU). The best option depends on how you use Power BI, how many people need access to reports and whether your organisation requires advanced enterprise features. In this guide, we compare Power BI Free vs Pro vs Premium to help you choose the right Power BI plan for your needs. Power BI Free: Best for Beginners and Individual Users Power BI Free is a good starting point for students, beginners and individuals who want to learn Power BI or create reports for personal use. With a free account, users can create reports and dashboards and work with their own Power BI content. However, the main limitation is collaboration. Free users generally cannot publish content to shared app workspaces or share reports with others unless the content is hosted in an eligible Premium/Fabric capacity. Power BI Free is ideal for: Best choice: If you are learning Power BI or analysing data for yourself, the Free version is often enough to get started. Power BI Pro: Best for Teams and Business Collaboration Power BI Pro is designed for professionals and organisations that need to publish, share and collaborate on Power BI reports. A Pro license allows users to publish content to app workspaces, share reports and collaborate with other users. Microsoft currently lists Power BI Pro in India at ₹1,165 per user/month, paid yearly, excluding applicable GST; pricing can vary by country and agreement. Power BI Pro is ideal for: For many businesses, Power BI Pro provides the best balance between cost and collaboration features. Best choice: Choose Power BI Pro if multiple users need to create, publish, share and collaborate on reports. Power BI Premium Per User: Best for Advanced Analytics Power BI Premium Per User (PPU) includes Power BI Pro capabilities plus access to many advanced Premium features. Microsoft positions PPU for data professionals and enterprise-scale workloads, including larger model sizes, more advanced capabilities and higher refresh limits. In India, Microsoft’s current listed price is ₹1,995 per user/month, paid yearly, excluding applicable GST. PPU can also provide advanced capabilities such as AI features and larger semantic model limits. However, content stored in a PPU workspace generally requires other users accessing that PPU content to also have appropriate PPU licensing. Power BI Premium Per User is ideal for: Best choice: Choose PPU when Pro features are not enough and your users require advanced Power BI capabilities. What About Power BI Premium Capacity? There is also a capacity-based approach for organisations that need to distribute Power BI content at scale. In current Microsoft licensing, this is closely connected with Power BI Premium capacity and Microsoft Fabric capacity. With qualifying Premium capacity or Fabric F64+ capacity, users with appropriate permissions can consume Power BI content without every viewer needing a paid per-user license, although report creators and publishers still require the appropriate paid license. This approach is typically more suitable for larger organisations with many report consumers. Power BI Free vs Pro vs Premium: Which Should You Choose? Here is a simple guide: Conclusion The right Power BI license depends on your goals. If you are learning Power BI, start with the Free version. If you need to share reports and collaborate with a team, Power BI Pro is usually the practical choice. For advanced analytics, larger models and Premium capabilities, Power BI Premium Per User may be the better option. Before purchasing, review your organisation’s number of report creators, collaborators and viewers, as well as your data size and advanced analytics requirements. For large-scale Power BI deployments, also consider how Microsoft Fabric capacity fits into your business intelligence strategy. In short: Free for learning, Pro for collaboration, Premium Per User for advanced analytics and capacity-based licensing for large-scale distribution. For current plans and pricing, see Microsoft Power BI pricing.
Read more

Top AI Features Every Power BI Developer Should Know

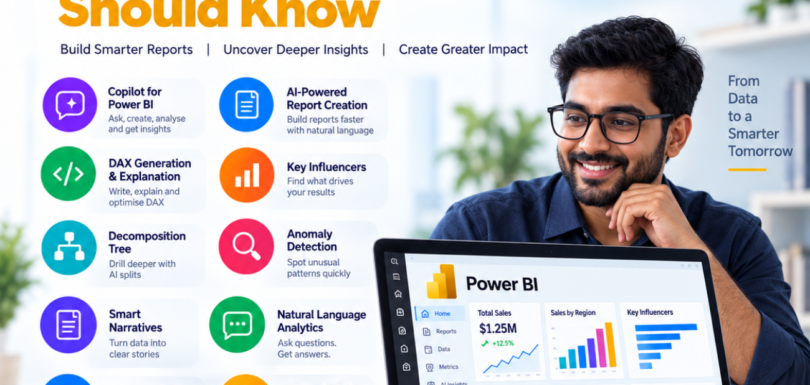
Top AI Features Every Power BI Developer Should Know Artificial Intelligence is transforming the role of the Power BI Developer. In the past, Power BI development mainly focused on connecting data sources, cleaning data, building data models, writing DAX formulas and creating dashboards. While these skills remain essential, AI is now adding new ways to analyse data, create reports and interact with business intelligence solutions. In 2026, a successful Power BI Developer should understand how to combine traditional data analytics skills with AI-powered features. Microsoft Power BI and Microsoft Fabric now include capabilities that can help developers generate insights, create reports using natural language, analyse key business drivers and identify unusual patterns in data. This article explores the top AI features every Power BI Developer should know and explains how these tools can improve data analysis, dashboard development and business decision-making. 1. Copilot for Power BI One of the most important AI features for Power BI Developers is Copilot for Power BI. Copilot uses generative AI to help users interact with data and reports using natural language. Depending on the Power BI experience and available capabilities, Copilot can help with tasks such as asking questions about data, generating and explaining DAX, suggesting report pages and visuals, and creating narrative summaries. For example, instead of manually creating every part of a report, a developer may use prompts such as: Copilot does not eliminate the need for Power BI expertise. Developers still need to validate calculations, understand the business requirements and ensure the report is accurate. However, it can reduce repetitive work and improve productivity. For Power BI Developers, learning how to write effective prompts is becoming an increasingly useful skill. 2. AI-Powered Report Creation Creating reports traditionally requires developers to manually select visuals, configure fields and design report pages. AI-powered report authoring can make this process faster. Copilot in Power BI can help create and edit report pages using natural language prompts, allowing developers to describe the type of analysis or report they need. For example, a developer could request a report page focused on: AI can assist with the initial report structure, while the Power BI Developer focuses on refining the layout, validating the data and improving the user experience. This is especially useful when creating prototypes or exploring different dashboard ideas. However, good dashboard design still requires human judgement. A professional Power BI Developer must understand which KPIs matter to the business and how information should be presented to decision-makers. 3. Copilot for DAX Generation and Explanation DAX is one of the most important skills for Power BI Developers. Measures are used to calculate important business metrics such as: Copilot can assist advanced creators by helping write and explain DAX queries. Microsoft lists DAX generation and explanation among the AI capabilities available for Power BI semantic models. For example, a developer may ask AI to help create a calculation for: Year-over-year sales growth. Or: Calculate the percentage difference between actual revenue and budget. This can improve productivity, particularly when developers are learning complex calculations. However, developers should never copy AI-generated DAX without understanding it. DAX calculations depend on the data model, relationships, filter context and business requirements. A strong Power BI Developer should use AI as an assistant while continuing to develop strong DAX knowledge. 4. Key Influencers Visual The Key Influencers visual is one of Power BI’s most useful AI-powered analytics features. It helps users understand the factors that influence a selected business outcome. Power BI analyses available explanatory factors, ranks the factors that matter and displays them as key influencers. For example, a business might want to understand: Imagine an HR team wants to analyse employee attrition. The Power BI Developer can build a model containing information such as: The Key Influencers visual can help identify which factors are most strongly associated with the selected outcome. This allows Power BI reports to move beyond answering “What happened?” and begin exploring “What may be influencing the result?” 5. Decomposition Tree with AI Splits The Decomposition Tree is another important AI-powered visual. It allows users to break down a business metric across multiple dimensions and drill deeper into the data. Power BI’s AI capabilities can help identify the next dimension to explore based on selected criteria, making the visual useful for ad hoc exploration and root-cause analysis. For example, suppose a company experiences a decrease in sales. A Power BI Developer can start with: Total Sales Then break it down into: Region → Country → Product Category → Product → Customer Segment This makes it easier to identify where the problem is occurring. For example: Total Sales ↓→ Europe→ Product Category B→ Product X→ Enterprise Customers The developer can then investigate the specific business reason behind the decline. Decomposition Trees are particularly useful for: 6. Anomaly Detection Large datasets can contain thousands or millions of records. Manually identifying unusual patterns can be difficult and time-consuming. Anomaly Detection helps identify unexpected spikes and dips in line-chart data, highlighting unusual values that may require further investigation. Examples of anomalies include: For example, imagine a company normally generates between $50,000 and $70,000 in daily sales. One day, sales suddenly drop to $20,000. Anomaly Detection can help bring attention to this unusual change. The Power BI Developer can then investigate potential reasons, such as: Anomaly detection can help organisations identify potential problems faster. 7. Smart Narratives Data visualisation is important, but charts alone do not always communicate the full business story. The Smart Narrative visual can create text summaries that highlight important trends and insights. Developers can customize the language and format for their audience. For example, instead of requiring an executive to analyse multiple charts manually, a report can provide a summary such as: Revenue increased compared with the previous period, while one product category experienced slower growth. Smart narratives can improve: A Power BI Developer should understand that the goal of a dashboard is not simply to display charts. The goal is to help users understand: AI-powered narratives can help
Read more

How to Use AI Features in Power BI for Data Analysis

How to Use AI Features in Power BI for Data Analysis Artificial Intelligence (AI) is changing the way businesses analyse and understand data. Instead of spending hours manually exploring spreadsheets, creating calculations and searching for trends, data professionals can now use AI-powered features in Microsoft Power BI to discover insights faster and make better business decisions. Power BI has evolved from a traditional data visualisation tool into a more intelligent business analytics platform. AI features can help users identify trends, detect anomalies, ask questions using natural language and generate meaningful insights from large volumes of data. In this guide, you will learn how to use AI features in Power BI for data analysis, the benefits of AI-powered analytics and how businesses and data professionals can use these capabilities effectively. What Are AI Features in Power BI? AI features in Power BI are tools and capabilities that help users analyse data using artificial intelligence and machine learning technologies. Instead of manually reviewing every chart, table and report, AI can assist with identifying patterns, explaining changes and exploring data through natural language. Some important AI-powered capabilities available within the Power BI and Microsoft analytics ecosystem include: These tools can help both technical and non-technical users gain insights from data more efficiently. 1. Use Copilot to Explore and Analyse Data Copilot is changing the way users interact with business data. Instead of manually navigating through multiple reports, users can use natural language to explore information and understand their data. For example, a business user may want to ask: AI-assisted analytics can help users move more quickly from a business question to relevant insights. For Power BI professionals, this can also improve productivity. Instead of spending all their time performing repetitive analysis, analysts can focus more on validating insights, understanding business problems and recommending actions. However, users should always review AI-generated results and ensure that the underlying data is accurate. 2. Use Natural Language Queries to Ask Questions About Data One of the most useful AI capabilities in Power BI is the ability to explore data using natural language. Traditional data analysis often requires users to know exactly which visual, filter or calculation to use. Natural language analytics makes data exploration easier by allowing users to ask questions in a more conversational way. For example: “Show total sales by country.” “Compare this year’s revenue with last year’s revenue.” “Which product category has the highest profit?” “Show monthly sales trends.” This approach can make Power BI dashboards more accessible to managers, business owners and decision-makers who may not have advanced technical skills. For organisations, this can reduce the gap between business users and data teams by making analytics easier to understand and use. 3. Use AI to Identify Key Influencers The Key Influencers visual can help users understand the factors that influence a particular business outcome. For example, a company may want to understand: Instead of manually testing multiple variables, Power BI can analyse relationships within the available data and highlight factors that may influence the selected outcome. For example, an HR team could analyse employee data to identify factors associated with higher employee turnover. A sales team could analyse factors related to high-value customers. This type of AI-assisted analysis can help businesses move beyond simple reporting and begin investigating why something is happening. 4. Use Anomaly Detection to Identify Unusual Changes Large datasets can make it difficult to identify unusual patterns manually. An important AI-powered analytics approach is anomaly detection. An anomaly is an unexpected change or unusual data point. For example: AI-powered anomaly detection can help analysts identify these unusual changes more quickly. Imagine a business monitoring thousands of daily transactions. Instead of manually reviewing every number, analysts can focus their attention on unusual patterns that may require investigation. This can help organisations respond faster to potential problems and opportunities. 5. Use Smart Narratives to Explain Data Charts and dashboards are useful, but not everyone can immediately understand what the numbers mean. Smart narratives and AI-generated summaries can help transform data into easier-to-understand explanations. For example, instead of showing only a sales chart, a narrative may help explain that: Sales increased during a particular period, while one product category experienced slower growth. This can make reports easier for executives and non-technical stakeholders to understand. AI-assisted narratives can also improve data storytelling, which is an increasingly important skill for Power BI developers and data analysts. A good dashboard should not simply display numbers. It should help users understand: AI can help make this analytical process faster and more accessible. 6. Use Forecasting and Trend Analysis Businesses often want to understand not only what has happened but also what may happen in the future. Power BI can support forecasting and trend analysis for suitable time-based datasets. For example, organisations may analyse: Forecasting can help businesses plan for potential changes and make more informed decisions. However, forecasts should not be treated as guaranteed results. Their usefulness depends on factors such as data quality, historical patterns and changes in the business environment. Data professionals should always combine AI-generated forecasts with business knowledge and human judgement. 7. Use Decomposition Trees to Investigate Business Results The decomposition tree is another useful Power BI feature for exploring the reasons behind a business result. For example, imagine that total sales decreased. A user can investigate the result by breaking it down into different dimensions, such as: This allows analysts to move from a high-level business question to more detailed analysis. For example: Total Sales ↓ → Region ↓ → Product Category ↓ → Specific Product ↓ This process helps users identify where changes are happening. When combined with AI-assisted insights and business knowledge, decomposition analysis can make root-cause analysis faster and more effective. 8. Combine Power BI AI Features with Microsoft Fabric Microsoft Fabric is expanding the modern data and analytics ecosystem around Power BI. Businesses increasingly need to manage large amounts of data from multiple sources, including: Microsoft Fabric helps organisations bring different data and analytics workloads together. When
Read more

Is Power BI a Good Career in 2026?

Is Power BI a Good Career in 2026? As businesses continue to generate more data than ever before, the demand for professionals who can transform raw information into meaningful insights continues to grow. This has made Microsoft Power BI one of the most valuable business intelligence and data analytics skills for aspiring IT professionals. But with Artificial Intelligence (AI), automation and Microsoft Fabric changing the technology landscape, many people are asking: Is Power BI a good career in 2026? The short answer is yes. Power BI can be an excellent career choice for individuals interested in data analytics, business intelligence, reporting and data-driven decision-making. Why Is Power BI Still a Good Career in 2026? Companies across industries need to analyse sales, finance, marketing, operations, customer and employee data. However, raw data alone does not help businesses make better decisions. Organisations need skilled professionals who can collect, clean, analyse and visualise data. This is where Power BI professionals play an important role. A Power BI Developer or Data Analyst can create interactive dashboards, automate reports, develop data models and help decision-makers understand business performance. As more companies adopt digital transformation, cloud platforms and AI-powered analytics, the need for professionals with strong data skills is likely to remain important. What Skills Do You Need for a Power BI Career? Learning Power BI alone is not enough to build a successful career. In 2026, employers increasingly value professionals who understand the complete data analytics process. Important Power BI skills include: AI is also becoming an important skill. Power BI professionals should understand how to use AI-powered analytics tools, Copilot and Microsoft Fabric effectively while maintaining data quality, accuracy and governance. Power BI Career Opportunities Learning Power BI can open opportunities in several job roles, including: Professionals can also work as Power BI consultants, freelance dashboard developers or business intelligence specialists. Companies often require custom Power BI dashboard development, automated reporting and data analytics solutions, creating opportunities for professionals who can solve real business problems. Is AI Replacing Power BI Developers? AI is changing the way data professionals work, but it is not simply replacing the need for Power BI skills. AI can help generate summaries, assist with report creation and support data analysis. However, businesses still need professionals who understand business requirements, data quality, data modelling and how to interpret results correctly. The role is evolving from simply creating charts and reports to becoming a strategic data professional who can combine technical knowledge, AI tools and business understanding. How to Start a Career in Power BI A practical learning path is: Excel → SQL → Power Query → Power BI → DAX → Data Modelling → Dashboard Projects → Microsoft Fabric → AI and Copilot The most important step is to build real-world projects. Create dashboards for sales, finance, HR, marketing or operations and add them to your portfolio. A strong portfolio can demonstrate your practical skills to employers and clients. Conclusion So, is Power BI a good career in 2026? For individuals interested in data analytics and business intelligence, the answer is yes. Power BI remains a valuable skill, especially when combined with SQL, data modelling, DAX, Microsoft Fabric and AI. The future belongs to professionals who can do more than create attractive dashboards. The strongest Power BI professionals will understand data, business problems and AI-powered analytics—and use all three to help organisations make smarter decisions.
Read more

M Sendil Kumar

Tech Learniversity Blog

Meet M Sendil Kumar, Founder, Director & CEO of Tech Learniversity, leading our vision to make quality, technology-driven education accessible to learners worldwide.

Categories

Latest Posts

Tags

Subscribe Newsletter

Sign up to receive notifications about the latest news and events from us!

    x

    Contact With Us!

    13th Floor, 247 Park, Gandhi Nagar, Vikhroli West, Mumbai – 400079

    Mon – Sat: 9.00am – 23.00pm / Sunday/Holiday : Closed