

Business Analytics & Power BI Services
Tech Learniversity delivers Business Analytics & Power BI Services that transform complex business data into actionable insights through interactive dashboards, business intelligence, KPI reporting, and automation.
- Home Main
- Business Analytics & Power BI Services
Power BI Business Analytics & Business Intelligence Services
Turn Your Business Data Into Actionable Insights
Your business generates valuable data every day—from sales and transactions to customers, finance, inventory, operations and employee performance. But raw data is only useful when you can understand it and use it to make better business decisions.
Tech Learniversity provides Power BI business analytics, data analytics, business intelligence, MIS reporting and dashboard development services that help organizations transform complex business data into clear, interactive and actionable insights.
We work with data from Excel, CSV, SQL databases, CRM systems, ERP platforms, Google Sheets, APIs and other business applications to create customized dashboards and reporting solutions.
From Raw Data to Business Decisions
Data Collection → Data Cleaning → Data Transformation → Data Analysis → Power BI → Automated Reporting → Business Insights
Whether you need a simple Excel analysis, an interactive Power BI dashboard, a transaction monitoring system or a complete business intelligence solution, we can design an analytics solution around your business requirements.
Turn Your Business Data Into Smarter Decisions
Discover how customized Power BI dashboards, automated reports, and business intelligence solutions can give you clearer visibility into your business performance.
Request a Free ConsultationDiscuss Your DashboardOur Business Analytics & Power BI Services
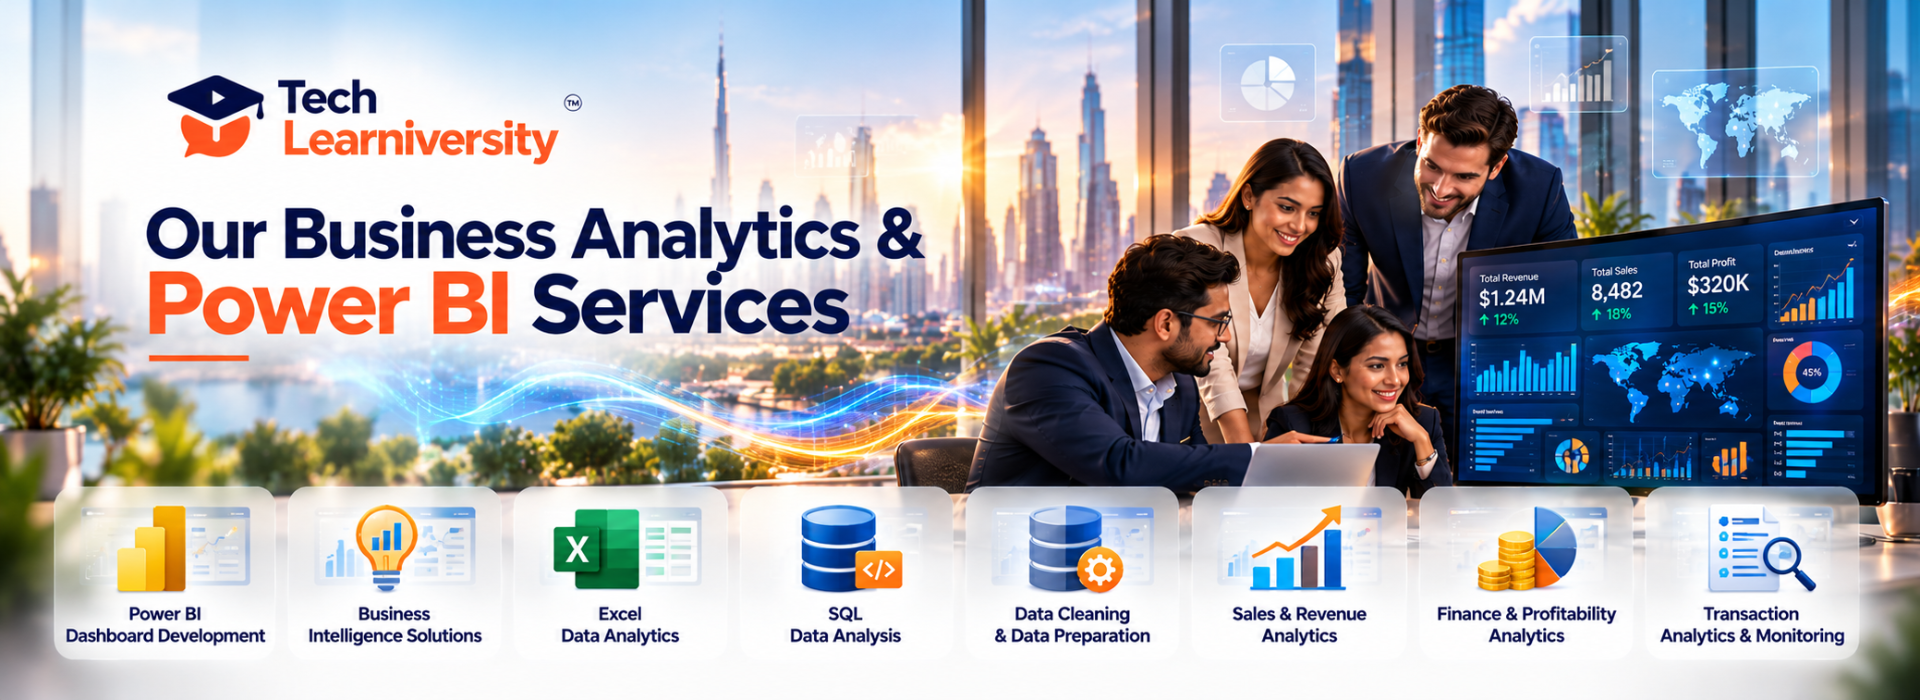
1. Power BI Dashboard Development
Turn your business data into interactive dashboards that allow management teams to monitor performance and identify trends quickly.
Our Power BI dashboard development services include:
- Interactive Power BI dashboards
- Executive dashboards
- Management dashboards
- KPI dashboards
- Sales dashboards
- Finance dashboards
- Operations dashboards
- Marketing dashboards
- HR dashboards
- Customer dashboards
- Inventory dashboards
- Transaction dashboards
- Branch performance dashboards
- Department dashboards
- Industry-specific dashboards
We design dashboards with interactive filters, drill-downs, drill-through reports, KPIs, charts, tables and business metrics relevant to your organization.
2. Business Intelligence Solutions
Transform Data Into Business Intelligence
Business intelligence helps organizations understand what is happening across different areas of their business.
Our business intelligence solutions can bring together information from multiple departments and data sources to provide management with a centralized view of business performance.
Business Intelligence Areas
- Sales intelligence
- Financial intelligence
- Customer intelligence
- Operations intelligence
- Transaction intelligence
- Inventory intelligence
- Marketing intelligence
- HR intelligence
- Supply chain intelligence
- Branch intelligence
- Management intelligence
Instead of relying on disconnected spreadsheets and manually prepared reports, your management team can access centralized business insights through interactive dashboards.
3. Excel Data Analytics
Turn Excel Data Into Meaningful Business Insights
Excel remains one of the most widely used business data tools. However, large and unstructured Excel files can make analysis time-consuming.
Our Excel data analytics services can help you organize, analyze and visualize your business data.
Excel Services
- Excel data cleaning
- Excel data analysis
- Advanced Excel analysis
- Pivot Tables
- Power Query
- Power Pivot
- Excel dashboards
- KPI reports
- Sales reports
- Financial reports
- Customer analysis
- Inventory analysis
- Automated Excel reports
- Multiple Excel file consolidation
We can also help transform Excel-based reporting processes into interactive Power BI dashboards.
4. SQL Data Analysis
Analyze Data Directly From Your Database
If your organization stores business information in databases, SQL can be used to extract and analyze valuable information.
Our SQL data analysis services include:
- SQL data extraction
- SQL queries
- Data filtering
- Data aggregation
- Joins
- Database analysis
- Transaction analysis
- Customer analysis
- Sales analysis
- Financial analysis
- Operational reporting
- SQL-based reporting
SQL data can also be connected to Power BI to create interactive business intelligence dashboards.
5. Data Cleaning & Data Preparation
Build Reliable Analytics From Clean Data
Poor-quality data can lead to inaccurate reports and misleading business insights.
Before building a dashboard, we can help prepare your data through:
- Duplicate removal
- Missing-data handling
- Data validation
- Data standardization
- Data transformation
- Data formatting
- Data consolidation
- Data restructuring
- Multiple-file consolidation
- Data quality checks
Our Approach
Raw Data → Clean Data → Structured Data → Analytics-Ready Data
This provides a stronger foundation for your Power BI dashboards and business reports.
6. Sales & Revenue Analytics
Understand Your Sales Performance
Our sales analytics solutions help businesses understand sales performance across products, customers, employees, branches and territories.
Sales Dashboard KPIs
- Total sales
- Revenue
- Orders
- Leads
- Opportunities
- Quotations
- Conversion rate
- Sales targets
- Target achievement
- Salesperson performance
- Product performance
- Customer performance
- Territory performance
- Branch performance
- Average order value
- Sales growth
- Month-over-month performance
- Year-over-year performance
Sales Intelligence Dashboard
Management can drill down from:
Company → Region → Branch → Salesperson → Customer → Product → Transaction
7. Finance & Profitability Analytics
Understand Where Your Money Goes
Our financial analytics dashboards provide visibility into revenue, expenses, profitability and financial performance.
Finance Dashboard
Track:
- Revenue
- Expenses
- Gross profit
- Net profit
- Profit margin
- Cash flow
- Accounts receivable
- Accounts payable
- Outstanding payments
- Collections
- Budget vs actual
- Department expenses
- Branch profitability
- Expense categories
Financial Intelligence
Instead of looking at multiple spreadsheets, management can view financial KPIs through a centralized dashboard.
8. Transaction Analytics & Monitoring
Monitor Every Transaction With Greater Visibility
Businesses that process large numbers of transactions need more than traditional reports.
Our Transaction Intelligence Dashboard can provide a centralized view of transaction activity and status.
Transaction Analytics
Track:
- Total transactions
- Transaction volume
- Transaction value
- Successful transactions
- Failed transactions
- Pending transactions
- Processing transactions
- Cancelled transactions
- Refunds
- Settlements
- Payment status
- Transaction aging
- Failed transaction reasons
- Customer transactions
- Branch transactions
- Product transactions
- Daily transaction trends
Transaction Status Dashboard
For example:
Total Transactions
Completed
Pending
Processing
Failed
Cancelled
Refunded
Management can filter transactions by:
Date → Customer → Branch → Product → Payment Method → Status
This can be particularly useful for e-commerce companies, retailers, financial businesses, logistics companies, distributors and transaction-driven organizations.
9. Customer Analytics
Understand Your Customers Better
Customer data can reveal purchasing patterns, customer value and opportunities for retention.
Our customer analytics dashboards can track:
- New customers
- Existing customers
- Repeat customers
- Customer frequency
- Customer revenue
- Customer profitability
- Customer segmentation
- Top customers
- Inactive customers
- Customer retention
- Customer churn
- Customer lifetime value
- Purchase behavior
Customer Intelligence
Identify:
Who are your most valuable customers?
Which customers are becoming inactive?
Which products do customers purchase?
Which customer segments generate the most revenue?
10. Inventory Analytics
Improve Inventory Visibility
Inventory problems can affect cash flow, sales and customer satisfaction.
Our inventory dashboards can provide visibility into:
- Current stock
- Stock value
- Stock movement
- Fast-moving products
- Slow-moving products
- Dead stock
- Stock aging
- Reorder levels
- Inventory turnover
- Warehouse inventory
- Product availability
- Purchase trends
Inventory Intelligence
Management can identify products that are:
Fast Moving | Slow Moving | Overstocked | Understocked | Aging | Out of Stock
11. Supply Chain Analytics
Improve Supply Chain Performance
Our supply chain dashboards can bring together purchasing, supplier, inventory and delivery information.
Track:
- Suppliers
- Purchase orders
- Procurement
- Supplier performance
- Delivery performance
- Lead time
- Delays
- Inventory
- Warehouses
- Transportation
- Logistics costs
This helps management identify operational delays and supplier performance trends.
12. Operations & KPI Analytics
Measure Operational Performance
Our operations dashboards help organizations monitor business processes and key performance indicators.
Track:
- Orders
- Processing
- Completed tasks
- Pending tasks
- Delays
- SLA performance
- Productivity
- Team performance
- Employee performance
- Branch performance
- Department performance
- Operational bottlenecks
KPI Dashboard
Create customized KPIs based on your organization’s business objectives.
13. MIS Reporting Services
Replace Manual MIS Reporting With Smarter Reporting
Many businesses still spend hours preparing daily, weekly and monthly MIS reports.
Tech Learniversity can help organizations design structured and automated MIS reporting systems.
MIS Reporting Services
- Daily MIS reports
- Weekly MIS reports
- Monthly MIS reports
- Sales MIS
- Finance MIS
- Operations MIS
- HR MIS
- Inventory MIS
- Branch MIS
- Department MIS
- Management MIS
Automated MIS Reporting
Business Data → Data Processing → Dashboard → Report → Management
Reduce repetitive manual reporting and give management access to consistent business information.
14. Executive & Management Dashboards
Give Leadership a Single View of Business Performance
Our executive dashboards bring the most important business KPIs into one place.
CEO / Management Dashboard
Monitor:
- Revenue
- Profit
- Sales
- Customers
- Transactions
- Outstanding payments
- Inventory
- Target achievement
- Business growth
- Operational performance
- Critical exceptions
Management can then drill down from high-level KPIs into the underlying business data.
15. Logistics & Shipping Analytics
Power BI Solutions for Logistics & Shipping Businesses
Logistics companies manage large volumes of shipment, customer, operational and financial data.
Our logistics analytics solutions can monitor:
- Total shipments
- Delivered shipments
- In-transit shipments
- Pending shipments
- Delayed shipments
- Cancelled shipments
- Shipment value
- Revenue
- Cost
- Profit
- Customer shipments
- Route performance
- Carrier performance
- Delivery time
- On-time delivery
- Shipment status
Logistics Intelligence
Shipment → Customer → Route → Carrier → Delivery → Revenue
This can provide management with a centralized view of logistics operations.
16. E-commerce Analytics
Understand Your Online Business Performance
Our e-commerce dashboards can combine sales, customer, order, product and payment data.
E-commerce Analytics
Sales
- Orders
- Revenue
- Average order value
- Product sales
Customers
- New customers
- Repeat customers
- Customer value
Orders
- Pending
- Processing
- Shipped
- Delivered
- Cancelled
- Returned
Payments
- Successful
- Failed
- Pending
- Refunded
Products
- Best sellers
- Slow-moving products
- Product profitability
17. Retail Analytics
Power BI Dashboards for Retail Businesses
Monitor:
- Store sales
- Product sales
- Customer sales
- Inventory
- Store profitability
- Daily sales
- Monthly sales
- Transactions
- Average transaction value
- Top products
- Store comparison
For businesses with multiple branches, management can compare locations using interactive dashboards.
18. Manufacturing Analytics
Manufacturing Business Intelligence
Manufacturing organizations can combine production, inventory, procurement, quality and operational data.
Production Analytics
- Production volume
- Target vs actual
- Production efficiency
- Machine utilization
- Capacity utilization
Quality Analytics
- Defects
- Rejections
- Quality rate
- Product quality
Inventory Analytics
- Raw materials
- Work in progress
- Finished goods
- Stock levels
Procurement Analytics
- Suppliers
- Purchase orders
- Procurement costs
- Supplier performance
Operations
- Downtime
- Productivity
- Production performance
19. Recruitment Analytics
Recruitment & Staffing Business Intelligence
Recruitment agencies can monitor their complete recruitment funnel.
Recruitment Dashboard
- Candidates
- Applications
- Screening
- Shortlisting
- Interviews
- Selections
- Joining
- Rejections
- Open positions
- Client requirements
- Recruiter performance
- Placement rate
- Time-to-hire
- Revenue
- Outstanding payments
This can help recruitment organizations understand recruiter productivity, client requirements and placement performance.
20. Education Analytics
Power BI Solutions for Schools, Colleges, Universities & Training Institutes
Tech Learniversity can also provide analytics solutions specifically for the education sector.
Student Analytics
- Total students
- Active students
- New admissions
- Course-wise students
- Batch-wise students
- Attendance
- Performance
- Completion
Education Finance
- Fees collected
- Fees pending
- Revenue
- Outstanding fees
Course Analytics
- Enrollment
- Completion
- Performance
- Revenue
Placement Analytics
- Students placed
- Companies
- Salary
- Placement rate
21. HR Analytics
Make Workforce Data Easier to Understand
HR dashboards can provide visibility into:
- Employee headcount
- Hiring
- Attrition
- Attendance
- Leave
- Department headcount
- Employee costs
- Recruitment
- Performance
- Training
- Employee turnover
22. Marketing Analytics
Measure Marketing Performance
Connect marketing and business data to understand the relationship between campaigns, leads, customers and revenue.
Track:
- Leads
- Campaigns
- Website traffic
- Conversions
- Cost per lead
- Customer acquisition cost
- Revenue
- Campaign ROI
- Channel performance
- Social media performance
Marketing data can be combined with CRM and sales data to create a broader Marketing-to-Revenue Dashboard.
23. Branch & Location Analytics
Compare Business Performance Across Locations
For organizations with multiple branches, offices, stores or territories, create dashboards that compare:
- Revenue
- Sales
- Customers
- Transactions
- Expenses
- Profit
- Employees
- Productivity
- Inventory
Interactive Drill-Down
Country → State → City → Branch → Department
24. Data Integration & Power BI Connectivity
Connect Your Business Data
We can design reporting solutions using data from multiple sources, depending on the client’s technology environment.
Potential Data Sources
- Microsoft Excel
- CSV
- SQL Server
- MySQL
- PostgreSQL
- CRM systems
- ERP systems
- Google Sheets
- APIs
- Cloud databases
- Business applications
Data Integration Process
Multiple Data Sources → Data Transformation → Data Model → Power BI → Dashboard
25. Power BI Automation
Automate Your Business Reporting
Reduce repetitive reporting tasks through automated data and reporting workflows.
Our solutions can include:
- Automated data refresh
- Scheduled reporting
- Automated Excel reports
- Automated management reports
- Scheduled PDF reports
- Email reporting
- KPI alerts
- Exception reporting
- Dashboard updates
26. Business Intelligence Automation
Power BI + Automation
We can combine business intelligence with automation workflows.
For example:
CRM / ERP / Database
↓
Business Data
↓
Power BI Dashboard
↓
KPI Monitoring
↓
Exception Detected
↓
Automated Notification
↓
Management Action
This approach can help organizations move from simply viewing data to acting on important business events.
27. Data-to-Decision Consulting
Build Analytics Around Your Business Decisions
Every business doesn’t need the same dashboard.
Instead of simply creating charts, we first understand:
- What decisions does management make?
- What KPIs matter?
- What data is available?
- Where are reporting problems occurring?
- Which reports are currently manual?
- Which business processes need visibility?
- Which data sources need integration?
We then design an analytics solution around the organization’s actual requirements.
28. Power BI Training & Corporate Data Analytics Training
As an EdTech organization, Tech Learniversity also provides training programs for organizations that want to develop internal analytics capabilities.
Corporate Training
- Power BI Training
- Excel Training
- Advanced Excel Training
- SQL Training
- Data Analytics Training
- Business Intelligence Training
- Power Query Training
- DAX Training
- Data Visualization Training
Training can be customized for:
- Employees
- Analysts
- Managers
- Finance teams
- Sales teams
- Operations teams
- HR teams
- IT teams
29. Power BI Support & Managed BI Services
Continuous Analytics Support
Your business requirements don’t stop after a dashboard is launched.
Our managed BI services can include:
- Dashboard maintenance
- Data refresh monitoring
- New KPI development
- Report modifications
- Data-source changes
- Performance optimization
- Monthly analytics review
- Dashboard enhancements
- User support
- Continuous reporting improvements
Managed Business Intelligence
Get ongoing support for your organization’s reporting and analytics environment.
Find the Right Analytics Solution for Your Business
Whether you need data analysis, interactive dashboards, automated MIS reports or complete business intelligence solutions, let's identify what works for your organization.
Discuss Your RequirementsRequest a ConsultationIndustries We Serve

Our Business Analytics and Power BI solutions can be customized for organizations across multiple industries.
Key Industries
- Logistics & Shipping
- E-commerce
- Retail
- Manufacturing
- Recruitment & Staffing
- Education & EdTech
- Healthcare
- Automotive
- Financial Services
- Insurance
- Distribution & Wholesale
- Professional Services
- Startups
- SMEs
- Multi-branch Businesses
Business Intelligence Built Around Your Industry
Every industry has different challenges, KPIs and reporting requirements. Explore a customized analytics solution designed around your business operations.
Explore Industry SolutionsDiscuss Your Business NeedsWho Can Benefit From Our Services?
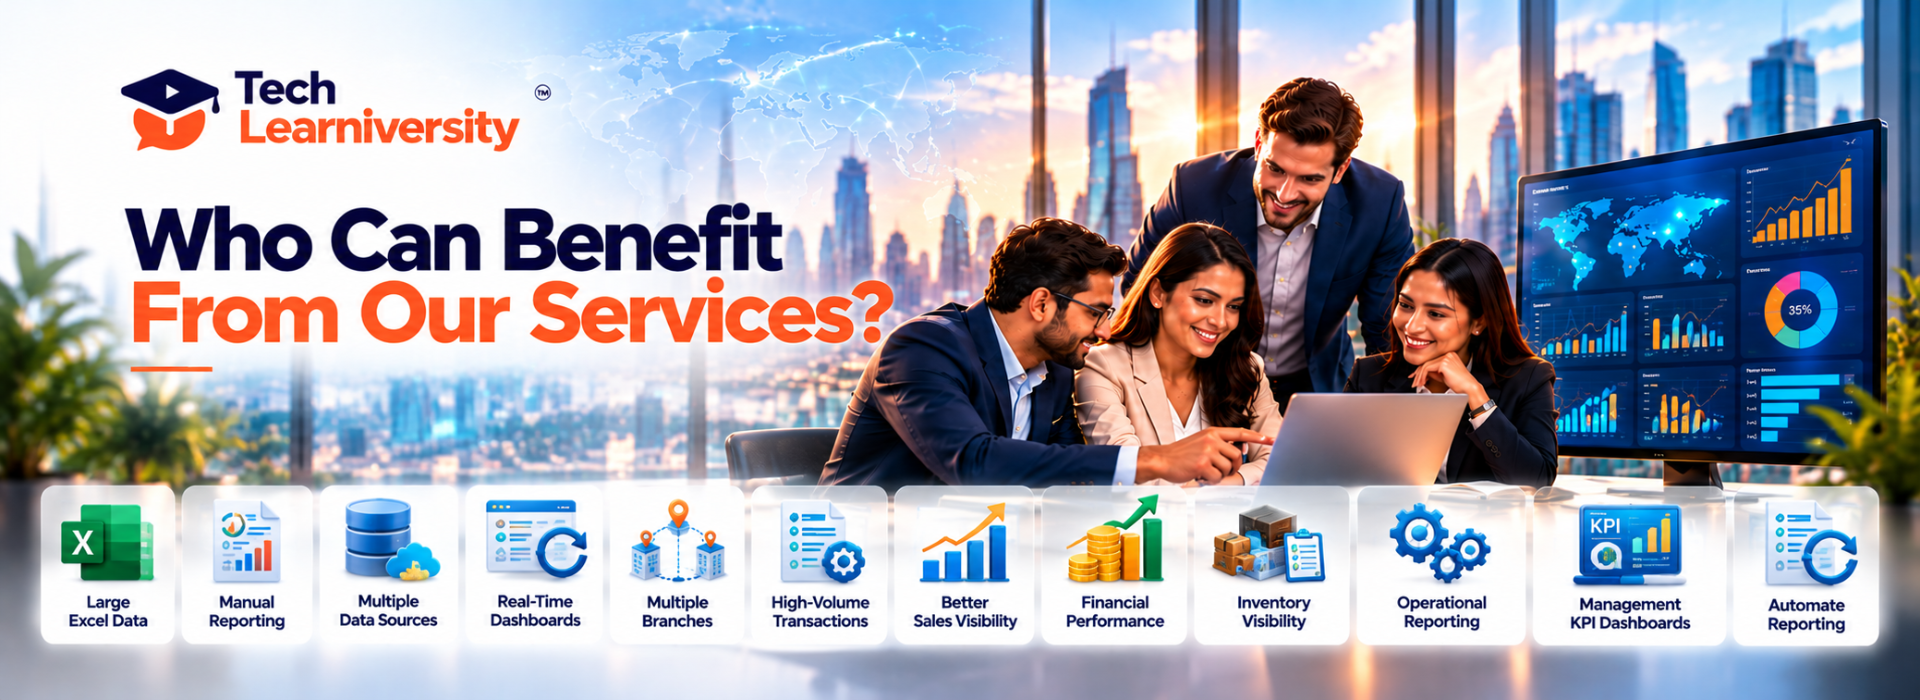
Our Power BI and business analytics solutions are suitable for organizations that:
- Manage large amounts of Excel data
- Prepare reports manually
- Have multiple business data sources
- Need real-time or regularly refreshed dashboards
- Have multiple branches
- Process large numbers of transactions
- Need better sales visibility
- Want to monitor financial performance
- Need inventory visibility
- Want to improve operational reporting
- Need management-level KPI dashboards
- Want to automate repetitive reporting
Spending Too Much Time Preparing Reports?
If your teams rely on multiple spreadsheets, manual reporting or disconnected business systems, let's explore how dashboards and automation can simplify your reporting.
Simplify Your ReportingTalk to an Analytics SpecialistOur Business Analytics Process
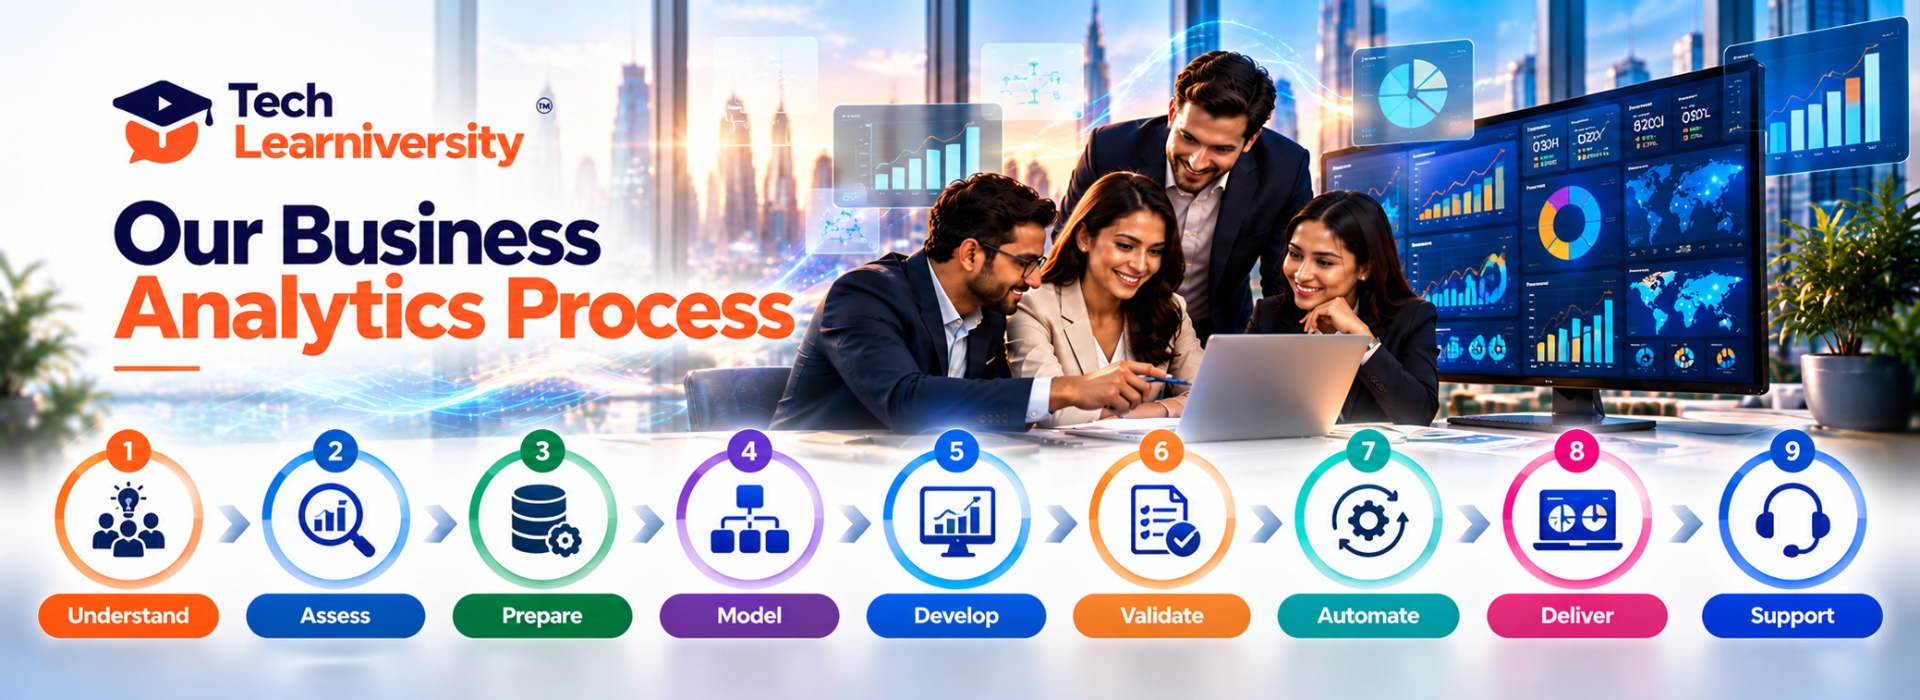
Step 1 — Understand
We understand your business, reporting requirements, KPIs and decision-making processes.
Step 2 — Assess
We review your existing Excel files, databases, CRM, ERP and other data sources.
Step 3 — Prepare
We clean, transform and structure the data for analytics.
Step 4 — Model
We create an appropriate data model for reporting and analysis.
Step 5 — Develop
We build your Power BI dashboards, reports and KPI visualizations.
Step 6 — Validate
We validate the calculations, KPIs and dashboard outputs against your source data.
Step 7 — Automate
Where appropriate, we implement refresh schedules and reporting automation.
Step 8 — Deliver
We provide the completed dashboard and reporting solution.
Step 9 — Support
We can continue supporting your analytics environment through ongoing maintenance and managed BI services.
From Business Requirements to Actionable Insights
Start with your reporting challenges and business goals. We'll help define an analytics approach covering data preparation, dashboard development, validation and ongoing support.
Start Your Analytics ProjectDiscuss Our ProcessFrom Excel Reports to Business Intelligence
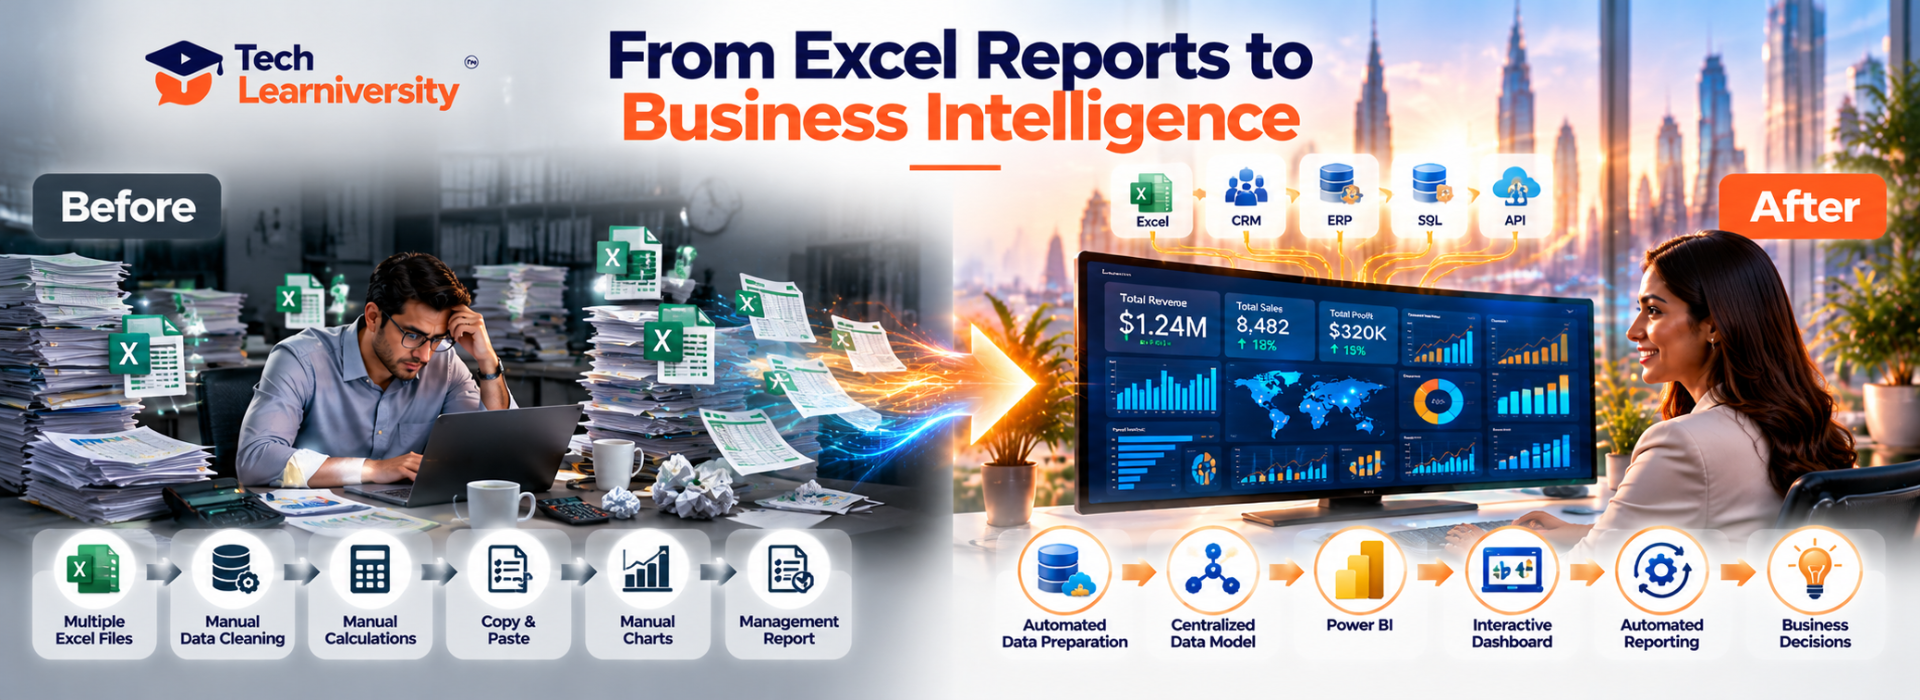
Before
Multiple Excel Files
↓
Manual Data Cleaning
↓
Manual Calculations
↓
Copy & Paste
↓
Manual Charts
↓
Management Report
After
Excel / CRM / ERP / SQL / API
↓
Automated Data Preparation
↓
Centralized Data Model
↓
Power BI
↓
Interactive Dashboard
↓
Automated Reporting
↓
Business Decisions
Move Beyond Manual Excel Reporting
Bring your spreadsheets and business data together into interactive Power BI dashboards, with automated reporting workflows where appropriate.
Transform Your Excel ReportsDiscuss Power BI AutomationWhy Choose Tech Learniversity?

Business-Focused Analytics
We focus on the business questions behind the data, not just creating attractive charts.
Customized Solutions
Every organization has different KPIs, processes and reporting requirements. Our dashboards can be customized accordingly.
Multiple Data Sources
Bring data together from Excel, CSV, databases, CRM, ERP and other business systems.
Scalable Solutions
Start with one dashboard and expand into a broader business intelligence environment.
Analytics + Training
As an EdTech organization, we can provide both BI implementation and corporate analytics training.
Ongoing Support
Continue improving your dashboards, KPIs and reporting processes as your business grows.
Build Business Intelligence Around What Matters
Get business-focused analytics, customized reporting solutions, multi-source data integration, scalable dashboards and the option of corporate training and ongoing support.
Partner With Tech LearniversitySchedule a ConsultationOur Business Intelligence Solutions
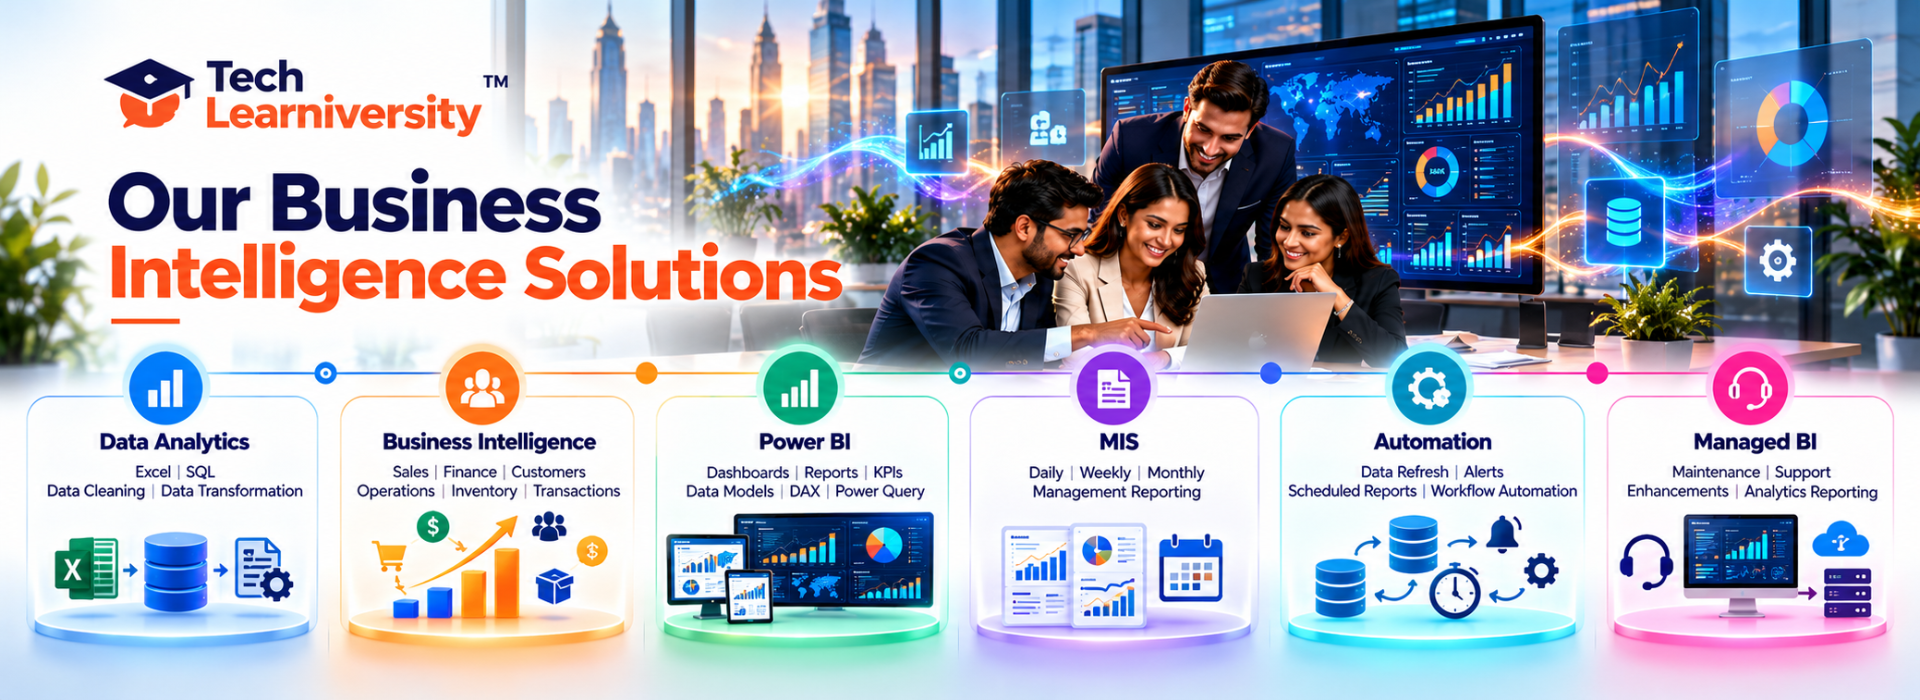
Data Analytics
Excel | SQL | Data Cleaning | Data Transformation
Business Intelligence
Sales | Finance | Customers | Operations | Inventory | Transactions
Power BI
Dashboards | Reports | KPIs | Data Models | DAX | Power Query
MIS
Daily | Weekly | Monthly | Management Reporting
Automation
Data Refresh | Alerts | Scheduled Reports | Workflow Automation
Managed BI
Maintenance | Support | Enhancements | Analytics Reporting
One Analytics Partner. Multiple Business Solutions.
From Excel and SQL analytics to Power BI, MIS reporting, automation and managed BI, explore solutions that can grow alongside your reporting needs.
Explore Your BI RequirementsTalk to Our TeamFrequently Asked Questions About Business Analytics & Power BI Services
1. What is Power BI dashboard development?
2. Can you create a Power BI dashboard from Excel data?
3. Can you connect Power BI to SQL databases?
4. Can you create transaction dashboards?
5. Can you automate MIS reports?
6. Can you build dashboards for multiple branches?
7. Do you provide Power BI training?
8. Do you provide ongoing Power BI support?

Blogs
How AI Is Changing Microsoft Power BI in 2026
Ready to Turn Your Data Into Business Intelligence?
Your business already has valuable data.
The question is whether you can turn that data into information that helps your team make better decisions.
Tech Learniversity can help you transform raw business data into interactive Power BI dashboards, automated MIS reports and actionable business intelligence.
Let's Build Your Business Intelligence Solution
Tell us about your Excel, CRM, ERP, SQL or other business data. Our team can discuss your reporting challenges and explore a customized Power BI or business analytics solution.
Request a Free ConsultationDiscuss Your Dashboard