

Microsoft Power BI Professional Certification Course
Start your Power BI journey from the basics and progress to practical, intermediate-level reporting skills. Learn how to import and clean data, build relationships, create DAX measures, design interactive dashboards and publish reports. Complete two hands-on business projects with guidance from an instructor.
Course Details
From: Tech Learniversity
Start Day: Coming Soon
Project Duration: 50 Hours
Get in Touch with Tech Learniversity
Call us directly or email us!
Address Business
Hindustan C. Bus Stop,
Lal Bahadur Shastri Rd,
Gandhi Nagar, Vikhroli West,
Mumbai - 400079,
Maharashtra, India
Contact With Us
HR: (+91) 70217 89240
business@techlearniversity.com
hr@techlearniversity.com
Working Time
Holiday : Closed
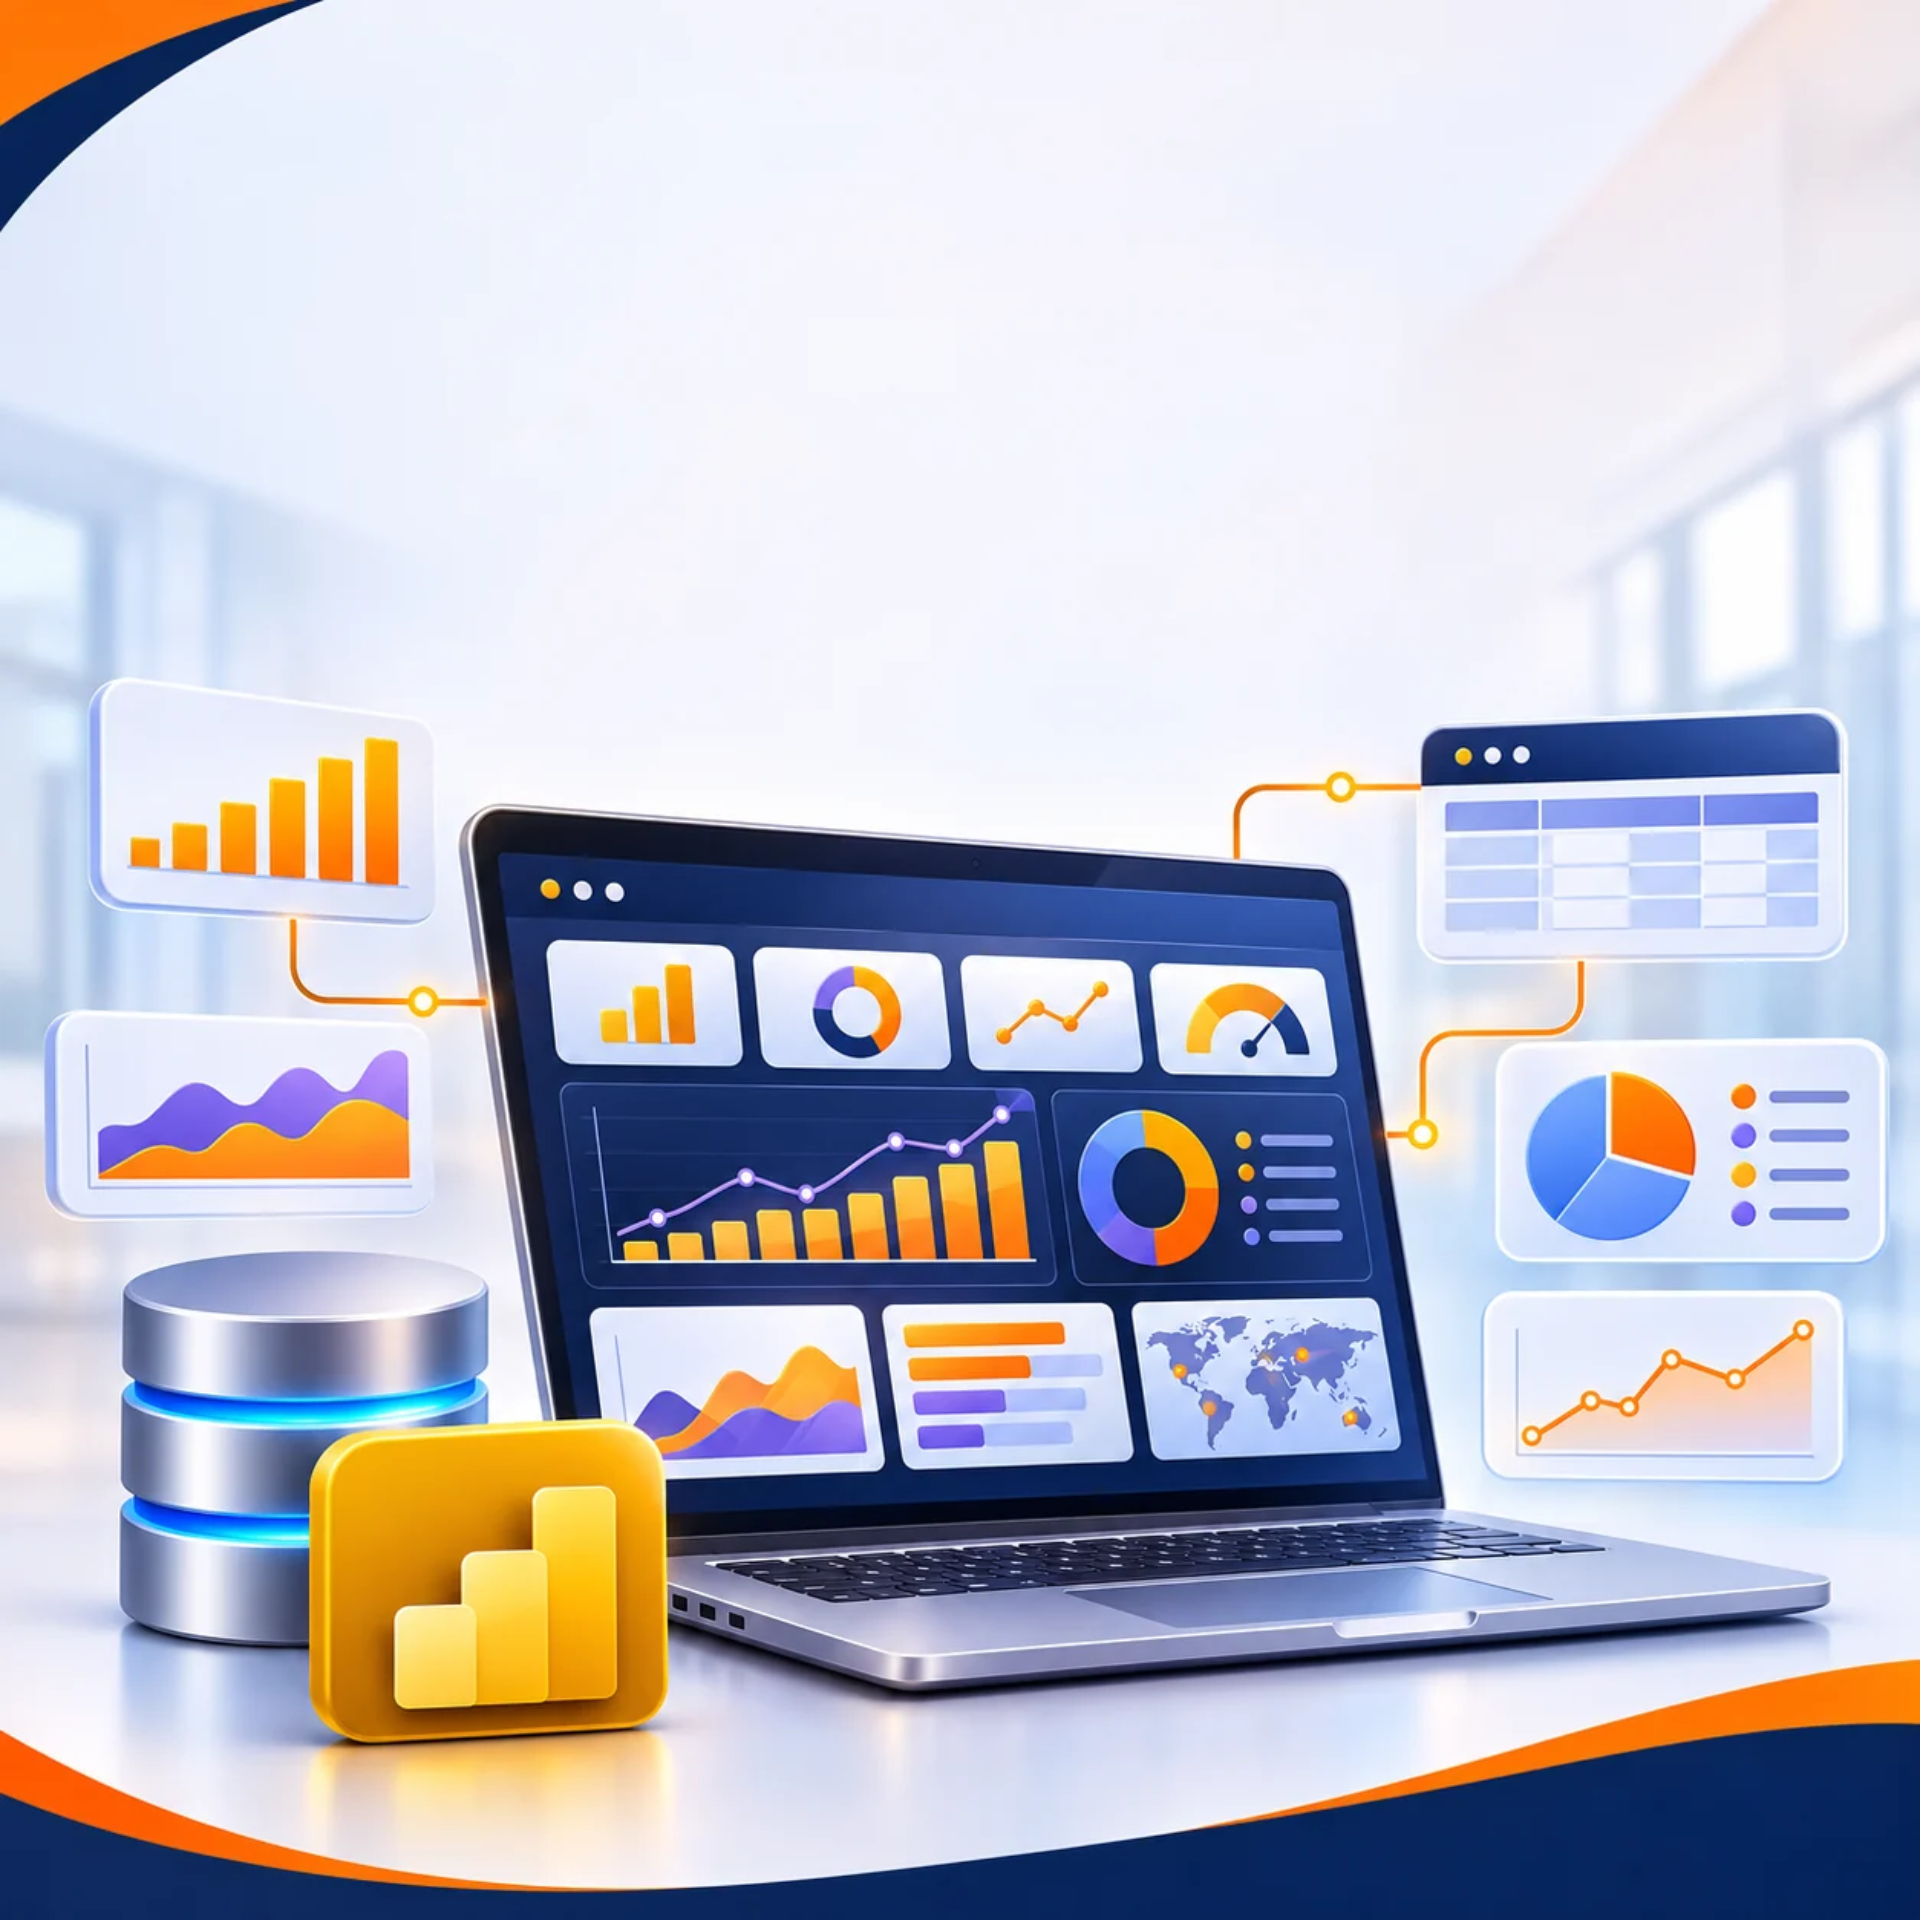
Microsoft Power BI Professional Certification Course
Tech Learniversity’s Microsoft Power BI Professional Certification Course is a beginner-friendly, 50-hour, live instructor-led course for students and working professionals who want to turn everyday business data into clear, interactive reports. The course starts with the Power BI interface and familiar Excel/CSV datasets, then progresses through Power Query, simple data modeling, DAX-based KPIs, dashboard design and report sharing.
Learners build step by step using prepared business datasets rather than assuming previous Power BI experience. They practice importing and correcting data, creating table relationships, developing measures for revenue and profit, comparing performance over time and presenting insights through readable reports. Two scoped projects provide opportunities to demonstrate the entire reporting workflow.
Course Type
Mode: Online Live Instructor-led Training
Duration
50 Hours
Course Level
Beginner to Intermediate
Requirements
Hardware Requirements
- Laptop or desktop computer running a supported 64-bit version of Windows.
- Minimum 4 GB available RAM recommended for basic Power BI work; 8 GB or more preferred for smoother classroom use.
- Sufficient free storage for Power BI Desktop and datasets.
- Stable internet connection.
- Headphones and microphone for online training sessions.
Software Requirements
- Microsoft Power BI Desktop.
- Microsoft Excel or a compatible spreadsheet application.
- A modern web browser.
- Access to the provided training datasets.
- An appropriate Power BI Service account when participating in publishing or sharing exercises.
Some collaboration features may require paid licensing or an instructor-managed environment.
Pre-requisites
This course is designed for beginners.
Mandatory Prerequisites
- Basic computer knowledge.
- Ability to use files, folders and common office applications.
- Basic understanding of tables, rows and columns.
- Willingness to practice using business datasets.
Recommended but Optional
- Basic Microsoft Excel knowledge.
- Familiarity with simple formulas, tables and charts.
- Basic understanding of business reports.
Not Required
- Previous Microsoft Power BI experience.
- SQL knowledge.
- Python programming.
- Advanced Excel.
- Prior knowledge of DAX.
- Previous professional analytics experience.
Students can start learning Power BI from scratch.
Target Audience
- Students and graduates
- Complete Power BI beginners
- Excel users
- MIS and reporting executives
- Junior data analysts
- Business analysts
- Finance, HR, sales, marketing and operations professionals
- Career changers
- Business owners seeking to understand dashboards and performance reports.
Designation/Job Title
- Junior Power BI Developer
- Power BI Analyst
- Data Analyst – Power BI
- Business Intelligence Analyst
- Power BI Reporting Analyst
- Power BI Dashboard Developer
- MIS Analyst – Power BI
- Business Reporting Analyst
- Junior Business Intelligence Developer
- Power BI Specialist
Course Fee
Standard Course Fee: ₹19,999/-
Introductory Enrollment Fee: ₹16,999/-
Curriculum
- What is Business Intelligence? Reports, dashboards and everyday business examples
- Power BI ecosystem: Desktop, Service, semantic models and reports
- Install Power BI Desktop; tour the ribbon, data, model and report views
- Understand rows, columns, data types, dates and basic reporting questions
- Guided lab: import a simple sales file and build a first chart
Practical outcome: Create and save a first Power BI report from a provided Excel dataset.
- Working with basic Excel tables, CSV files, column headings and sample data
- Using Get Data to import Excel and CSV files, selecting sheets and tables
- Checking data types, blanks, incorrect values and basic data quality
- Guided lab: import and compare two simple business data sources
Practical outcome: Identify data quality problems and load prepared datasets with suitable data types.
- Power Query Editor: applied steps, query preview and refresh workflow
- Rename columns; set types; remove duplicates, blanks and errors
- Trim, clean, split, replace and transform dates; conditional columns
- Filter, sort, Group By and introductory pivot/unpivot operations
- Merge and append simple tables with a clear matching key
- Guided lab: combine monthly retail files and check totals
Practical outcome: Produce a clean, reproducible retail dataset from multiple input files.
- Understand fact and dimension tables through a sales example
- Keys, one-to-many relationships and basic cardinality
- Filter direction, common relationship errors and duplication pitfalls
- Build a simple calendar table and use date hierarchies
- Guided lab: connect Sales, Products and Calendar tables
Practical outcome: Build a beginner-friendly sales model and verify its relationships.
- DAX basics: measures vs. calculated columns and formula syntax
- SUM, COUNT, COUNTROWS and DISTINCTCOUNT in business reporting
- AVERAGE, DIVIDE and introductory CALCULATE
- IF and SWITCH for simple classification and status measures
- Understand filters and row context using visual examples
- Guided lab: Revenue, Orders, Profit, Margin and Average Order Value
Practical outcome: Build a small reusable KPI measure library with clearly named DAX measures.
- CALCULATE with filters and introductory ALL for totals
- Use a calendar table for YTD and previous-year measures
- Year-over-year change, basic running totals and rolling averages
- Guided lab: build current vs. prior-period performance comparisons
Practical outcome: Explain the difference between current-period and prior-period KPIs.
- Choose clear visuals: cards, bar/line charts, tables, matrices and slicers
- Use titles, formatting, themes and consistent numbers and units
- Report/page/visual filters, slicers and interaction basics
- Design readable layouts, basic accessibility and business narratives
- Guided lab: design a one-page Retail Sales Performance dashboard
Practical outcome: Create a readable dashboard answering specific business questions.
- Drill-down and introductory drillthrough navigation
- Bookmarks, buttons and report page navigation
- Tooltips and basic cross-filtering behavior
- Guided lab: improve a dashboard with interactive navigation
Practical outcome: Add a usable navigation path and at least one drillthrough detail page.
- Publish a Power BI Desktop report to the Power BI Service
- Understand reports, dashboards, workspaces and basic licensing
- Refresh concepts: credentials, scheduled refresh and gateway overview
- Demonstration: publish a report and review basic access settings
Practical outcome: Describe how a report moves from Desktop to a shared workspace.
- Introductory Row-Level Security and safe reportsharing concepts
- Permissions, privacy and practical data-validation checks
- Performance Analyzer overview and simplifying slow report pages
- Guided troubleshooting: refresh, missing data and display issues
Practical outcome: Apply a basic report publishing and quality assurance checklist.
- Guided Project 1: Retail Sales Performance report
- Project 2: HR or Financial Analytics mini dashboard
- Learner presentation, feedback and final practical knowledge check
Practical outcome: Submit two Power BI files, explain the KPIs and demonstrate report filtering and interpretation.
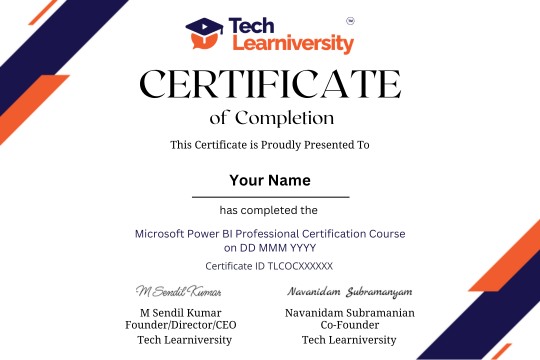
Certification of Completion
Tech Learniversity is proud to uphold ISO 9001:2015 Certified Quality Management System standards, reflecting our strong commitment to excellence and continual improvement. By adhering to globally recognized best practices, we deliver courses and services with consistent quality, reliability, and transparency.
Our QMS framework ensures that every training module—whether in Microsoft Power BI Professional Certification Course—follows meticulous processes for development, review, and learner support.
Ultimately, this certification demonstrates our pledge to meet and exceed the expectations of students and industry partners, cultivating trust and long-term success in all our educational offerings.

Quality Education from Quality People
Choose Tech Learniversity for quality education from industry experts committed to empowering your success. Embark on a transformative educational journey with Tech Learniversity and unlock your potential for a brighter future. Together, we can create meaningful experiences that inspire growth, collaboration, and success!
Exceptional Student Satisfaction
Impressive Job Placement Success
Diverse Course Offerings
Global Reach
“

What Our Students Say?
More than 99% students satisfaction is our success.
Oscar Frimpong
Fiorella Reynoso Donzelli
joe riah
Billy Oscar
Frequently Asked Questions
1. Is this Power BI course suitable for beginners?
2. Do I need to know SQL or programming?
3. Will I learn DAX?
4. Can I join without advanced Excel skills?
5. Are there practical projects?
6. Will I receive a certificate?
7. Will I become Microsoft Certified after completing the course?
8. Can I apply for Power BI jobs?
9. Will I learn to create professional Power BI dashboards?
10. What career opportunities can I explore after completing this course?

Get in Touch with Tech Learniversity!
Build Your Career with Tech Learniversity!
Address Business
Hindustan C. Bus Stop,
Lal Bahadur Shastri Rd,
Gandhi Nagar, Vikhroli West,
Mumbai - 400079,
Maharashtra, India
Contact With Us
HR: (+91) 70217 89240
Email Address
hr@techlearniversity.com
Working Time
Sunday/Holiday : Closed