

Microsoft Power BI Certification Course
Empower your career with Tech Learniversity’s Microsoft Power BI Certification Course, a hands‑on program designed to master data visualization, business intelligence, and interactive dashboard creation using real‑world projects.
- Home Main
- Microsoft Power BI Certification Course
Course Details
From: Tech Learniversity
Start Day: Coming Soon
Project Duration: 30 Hours
Get in Touch with Tech Learniversity
Call us directly or email us!
Address Business
Hindustan C. Bus Stop,
Lal Bahadur Shastri Rd,
Gandhi Nagar, Vikhroli West,
Mumbai - 400079,
Maharashtra, India
Contact With Us
HR: (+91) 70217 89240
business@techlearniversity.com
hr@techlearniversity.com
Working Time
Holiday : Closed

Microsoft Power BI Certification Course
The Microsoft Power BI Certification Course by Tech Learniversity is designed to help learners master end-to-end business intelligence (BI) processes — from data extraction and modeling to visualization and dashboarding. Through this hands-on program, you’ll learn to turn raw data into actionable insights using Microsoft’s premier BI tool.
Course Type
Mode: Online Live Instructor-led Training
Course Objectives
By the end of this Power BI Certification Course, you will:
– Understand end-to-end BI workflows using Power BI Desktop and Service.
– Learn DAX (Data Analysis Expressions) for advanced calculations and KPIs.
– Build interactive dashboards and publish insights using Power BI Service.
– Work with real-time data, DirectQuery, and Azure integration.
– Discover AI features such as Key Influencers, Decomposition Tree, and Smart Narratives.
– Prepare for Microsoft Power BI Certification (PL-300) and job roles in BI & Analytics.
Duration
30 Hours
Requirements
– A laptop/PC with minimum 4GB RAM
– Power BI Desktop (Free installation)
– Microsoft account for Power BI Service
Pre-requisites
– Basic understanding of Excel or SQL (helpful but not mandatory)
– Passion for data-driven decision making
– No coding background required
Target Audience
This program is ideal for:
– Data Analysts & Business Analysts
– Excel Professionals transitioning to BI
– Aspiring Data Scientists
– IT Professionals and Developers
– MBA Students and Business Managers
– Anyone aiming for a career in Business Intelligence or Analytics
Career and Future Prospects
Power BI specialists are in high demand globally. Successful learners can work as:
– Power BI Developer
– BI Analyst / Data Analyst
– Reporting Analyst
– Data Visualization Specialist
– Business Consultant
Industries hiring: IT Services, Banking, Retail, Healthcare, Manufacturing, and Consulting.
Designation/Title
– Business Intelligence Developer
– Power BI Specialist
– Data Analyst – Power BI
– BI Engineer
– Analytics Consultant
Course Fee
INR. 20000
Curriculum
* Overview of BI concepts
* Why we need BI?
* Introduction to SSBI
* SSBI Tools
* Why Power BI?
* What is Power BI?
* Building Blocks of Power BI
* Getting started with Power BI Desktop
* Get Power BI Tools
* Introduction to Tools and Terminology
* Dashboard in Minutes
* Refreshing Power BI Service Data
* Interacting with your Dashboards
* Sharing Dashboards and Reports
* Power BI Desktop
* Extracting data from various sources
* Workspaces in Power BI
* Data Transformation
* Measures and Calculated Columns
* Query Editor
* Introduction to Modelling
* Modelling Data
* Manage Data Relationship
* Optimize Data Models
* Setup and Manage Relationships
* Cardinality and Cross Filtering
* Default Summarization & Sort by
* Creating Calculated Columns
* Creating Measures & Quick Measures
* What is DAX?
* Data Types in DAX
* Calculation Types
* Syntax, Functions, Context Options
* DAX Functions
o Date and Time
o Time Intelligence
o Information
o Logical
o Mathematical
o Statistical
o Text and Aggregate
* Measures in DAX
* ROW Context and Filter Context in DAX
* Operators in DAX – Real-time Usage
* Quick Measures in DAX – Auto validations
* PowerPivot xVelocity & Vertipaq Store
* In-Memory Processing: DAX Performance
* How to use Visual in Power BI?
* What Are Custom Visuals?
* Creating Visualisations and Colour Formatting
* Setting Sort Order
* Scatter & Bubble Charts & Play Axis
* Tooltips and Slicers, Timeline Slicers & Sync Slicers
* Cross Filtering and Highlighting
* Visual, Page and Report Level Filters
* Drill Down/Up
* Hierarchies and Reference/Constant Lines
* Tables, Matrices & Conditional Formatting
* KPI’s, Cards & Gauges
* Map Visualizations
* Custom Visuals
* Managing and Arranging
* Drill through and Custom Report Themes
* Grouping and Binning and Selection Pane, Bookmarks & Buttons
* Data Binding and Power BI Report Server
* Why Dashboard? and Dashboard vs Reports
* Creating Dashboards
* Configuring a Dashboard: Dashboard Tiles, Pinning Tiles
* Power BI Q&A
* Quick Insights in Power BI
* Power BI embedded and REST API
* Custom Data Gateways
* Exploring live connections to data with Power BI
* Connecting directly to SQL Azure, HD Spark, and SQL Server Analysis Services/ MySQL
* Introduction to Power BI Development API
* Excel with Power BI: Connect Excel to Power BI, Power BI Publisher for Excel
* Content packs
* Update content packs
* Introduction and Sharing Options Overview
* Publish from Power BI Desktop and Publish to Web
* Share Dashboard with Power BI Service
* Workspaces and Apps (Power BI Pro) and Content Packs (Power BI Pro)
* Print or Save as PDF and Row Level Security (Power BI Pro)
* Export Data from a Visualization and Publishing for Mobile Apps
* Export to PowerPoint and Sharing Options Summary
* Key Influencers Visual – Find factors affecting a metric
* Decomposition Tree Visual – Root cause analysis
* Smart Narrative Visual – Auto-generate insights & summaries
* Q&A Visual – Natural language query interface
* Anomaly Detection – Detect outliers in time series data
* Using Column from Examples (AI-assisted data extraction)
* Text and image extraction using AI
* Integration with Azure Cognitive Services (Sentiment, Key Phrases, etc.)
* AI Insights functions in Power Query Editor
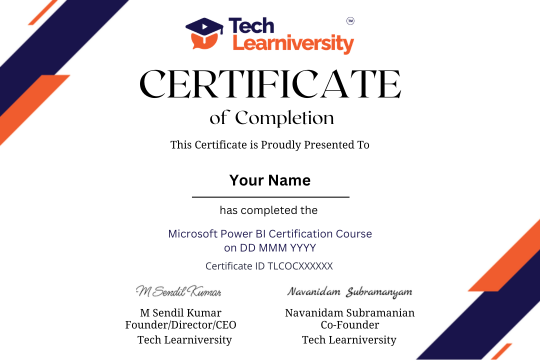
Certification of Completion
Tech Learniversity is proud to uphold ISO 9001:2015 Certified Quality Management System standards, reflecting our strong commitment to excellence and continual improvement. By adhering to globally recognized best practices, we deliver courses and services with consistent quality, reliability, and transparency.
Our QMS framework ensures that every training module—whether in Microsoft Power BI Certification Course—follows meticulous processes for development, review, and learner support.
Ultimately, this certification demonstrates our pledge to meet and exceed the expectations of students and industry partners, cultivating trust and long-term success in all our educational offerings.

Quality Education from Quality People
Choose Tech Learniversity for quality education from industry experts committed to empowering your success. Embark on a transformative educational journey with Tech Learniversity and unlock your potential for a brighter future. Together, we can create meaningful experiences that inspire growth, collaboration, and success!
Exceptional Student Satisfaction
Impressive Job Placement Success
Diverse Course Offerings
Global Reach
“

What Our Students Say?
More than 99% students satisfaction is our success.
Oscar Frimpong
Fiorella Reynoso Donzelli
joe riah
Billy Oscar
Course Questions
Explore common questions about the course.
What will I learn in the Microsoft Power BI Certification Course?
How long is the Microsoft Power BI Certification Course?
Do I need coding experience to learn Power BI?
Will I learn how to transform and prepare data in Power BI?
What data modelling skills will I learn?
Will I learn DAX in this course?
What Power BI visualisation skills will I learn?
Will I learn how to create and share Power BI dashboards?
Will I learn AI features in Power BI?
Will I work on practical Power BI projects?
Didn’t Find the Answer? Ask us Questions
Call us directly or email us!
Address Business
Hindustan C. Bus Stop,
Lal Bahadur Shastri Rd,
Gandhi Nagar, Vikhroli West,
Mumbai - 400079,
Maharashtra, India
Contact With Us
HR: (+91) 70217 89240
business@techlearniversity.com
hr@techlearniversity.com
Working Time
Holiday : Closed
Frequently Asked Questions
What is the difference between a Power BI report and a dashboard?
How can Power BI help businesses make better decisions?
Can I use Power BI with Excel and other data sources?
How will this course help me prepare for the PL-300 certification?

Get in Touch with Tech Learniversity!
Build Your Career with Tech Learniversity!
Address Business
Hindustan C. Bus Stop,
Lal Bahadur Shastri Rd,
Gandhi Nagar, Vikhroli West,
Mumbai - 400079,
Maharashtra, India
Contact With Us
Email Address
hr@techlearniversity.com
Working Time
Sunday/Holiday : Closed